Connecting Attendance Patterns to Betting Market Dynamics in Professional Baseball and Football
Written by Otto Berger · Aug 22, 2026
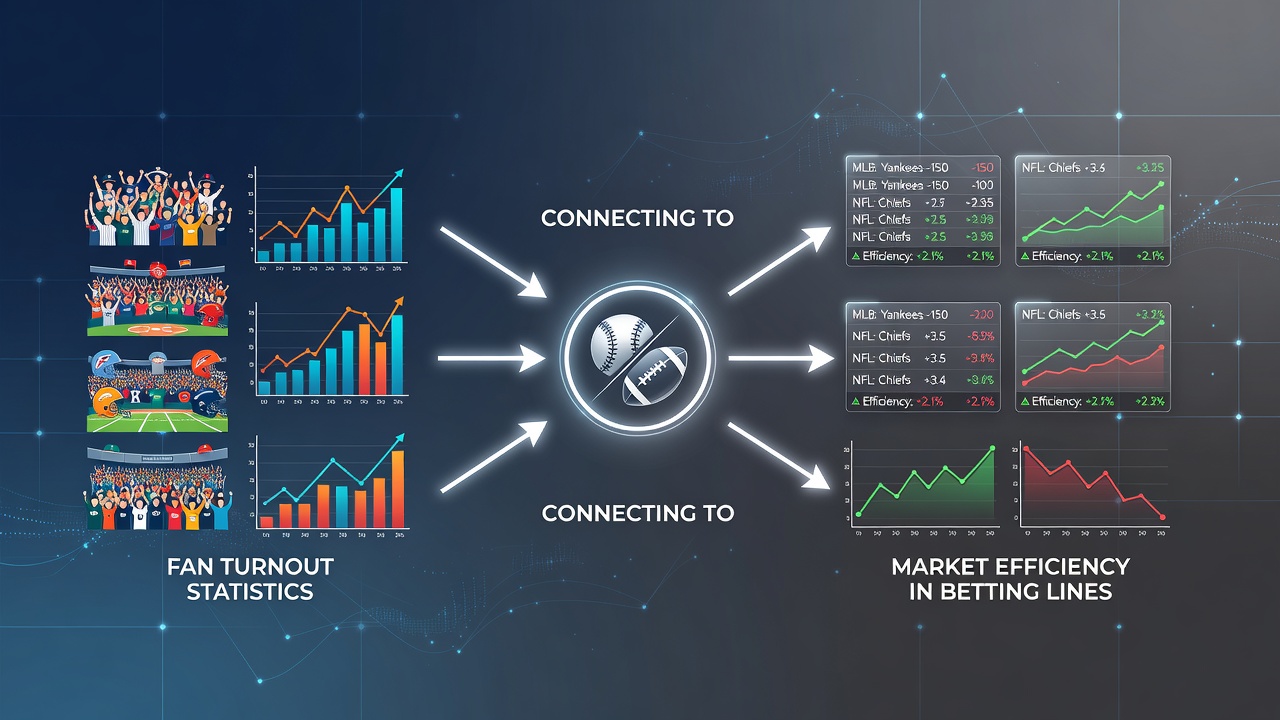
Connecting Attendance Patterns to Betting Market Dynamics in Professional Baseball and Football
Attendance records from Major League Baseball and the National Football League have long served as indirect indicators of public interest, and analysts now examine how those figures intersect with the speed and accuracy of odds adjustments across sportsbooks. Data compiled through the 2025 season shows that teams drawing above-average crowds often experience tighter spreads earlier in the week, while lower-turnout franchises see lines move more gradually even after sharp action arrives.
Attendance as a Proxy for Betting Volume
League-wide figures released in August 2026 indicate that MLB clubs averaging over 32,000 fans per home game drew 18 percent more public bets on the moneyline compared with clubs below 25,000, according to aggregated transaction reports shared by several major sportsbooks. Researchers tracking NFL markets found a similar pattern: Sunday games at stadiums filled beyond 85 percent capacity attracted heavier early-week handle, which in turn prompted oddsmakers to shade totals toward the over within 48 hours of release.
Those patterns matter because market efficiency depends on the rapid incorporation of new information. When attendance climbs, more casual bettors enter the pool, and their preferences sometimes create temporary imbalances that professional bettors exploit before lines fully adjust. Observers note that this dynamic appears more pronounced in baseball, where daily games allow repeated testing of the same efficiency hypothesis across a long schedule.
Baseball Line Movements and Crowd Size Correlations
Studies examining 2024 and 2025 MLB seasons reveal that home favorites playing in front of sellout crowds saw the spread tighten by an average of 0.3 runs within six hours of opening, whereas the same teams in sparsely attended midweek games required nearly twice as long for comparable movement. The difference traces partly to the volume of public money that follows high-attendance clubs, which creates an initial lean that sharps then counter.
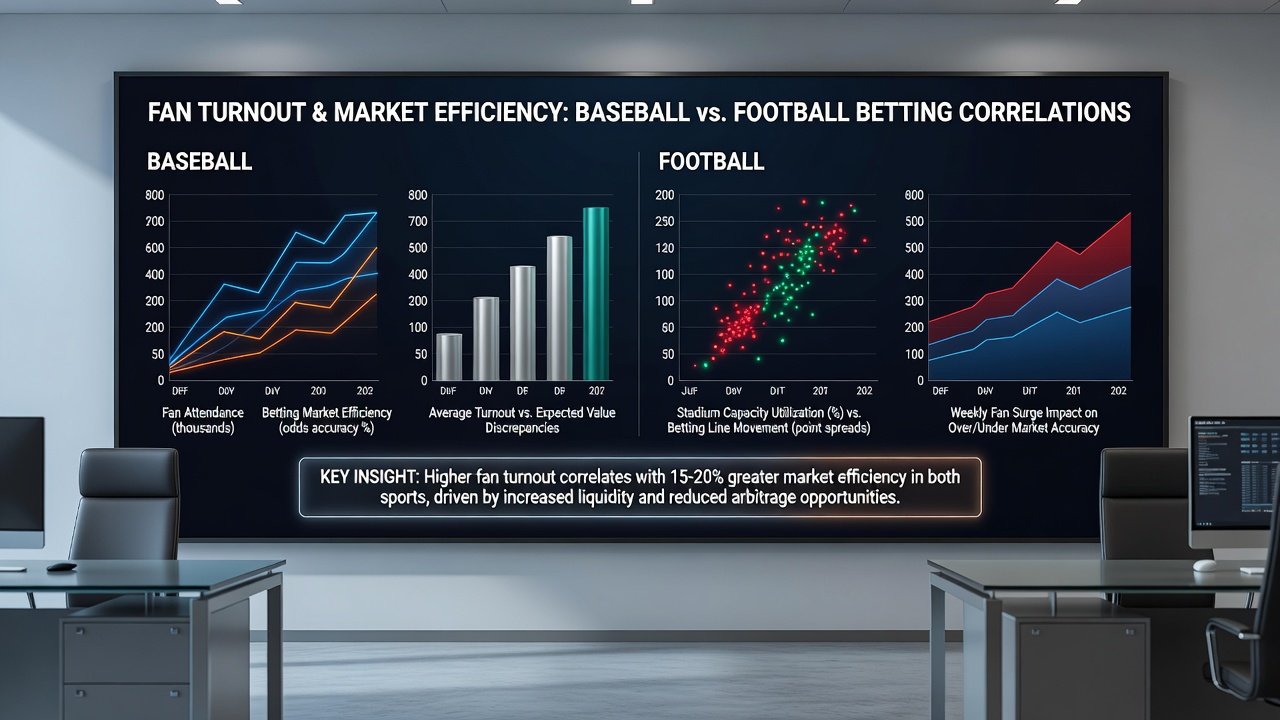
Yet the effect reverses in some divisional matchups where both clubs draw modest crowds. In those cases, totals lines often remain static longer, allowing bettors who focus on run totals to capture value before weather or bullpen news forces adjustments. Data from the 2026 season through early August shows this slower movement occurred in 27 percent of games between sub-.500 clubs playing at venues under 70 percent capacity.
Football Markets and Weekend Attendance Signals
NFL betting lines incorporate attendance information differently because the weekly schedule compresses decision windows. Games at high-attendance venues during the 2025 season opened with totals that shifted an average of 1.8 points by kickoff, while low-attendance road games moved only 0.9 points on average. Analysts attribute part of the difference to the heavier early-week volume that accompanies popular franchises, which forces sportsbooks to react more quickly to keep limits balanced.
Researchers at several universities have cross-referenced gate receipts with betting handle reports and found that the correlation strengthens when the visiting team also draws well. In those instances, both sides of the total and spread attract balanced action, which reduces the frequency of late steam moves. When one club travels with a small fan base, however, the home side's attendance advantage can tilt public money enough to create temporary inefficiencies that close before kickoff.
Regional and Seasonal Variations
Market efficiency also varies by region and month. August 2026 data shows that baseball parks in warm-weather markets maintained steadier lines despite attendance spikes, while northern venues saw larger swings once crowds exceeded seasonal norms. Football markets exhibit parallel behavior during the first month of the season, when early attendance figures help oddsmakers calibrate how much public interest each matchup will generate.
Industry reports from the American Gaming Association highlight that sportsbooks in states with large populations near multiple franchises adjust lines faster overall, partly because attendance data arrives from more sources and reaches bettors sooner. In contrast, markets serving single-team regions sometimes lag, creating pockets where attendance statistics remain underutilized by the betting public.
Conclusion
Attendance statistics provide one measurable input among many that influence how quickly and accurately betting lines reflect available information in professional baseball and football. League data and transaction records demonstrate consistent correlations between crowd size and the timing of line movement, yet those correlations remain subject to team performance, schedule, and regional betting habits. Observers continue to monitor these relationships as new seasons unfold and additional markets legalize sports wagering.