Exploring Player Fatigue Patterns in International Soccer Leagues to Refine Totals Wagering During Congested Fixtures
Written by Sam Walter · May 16, 2026
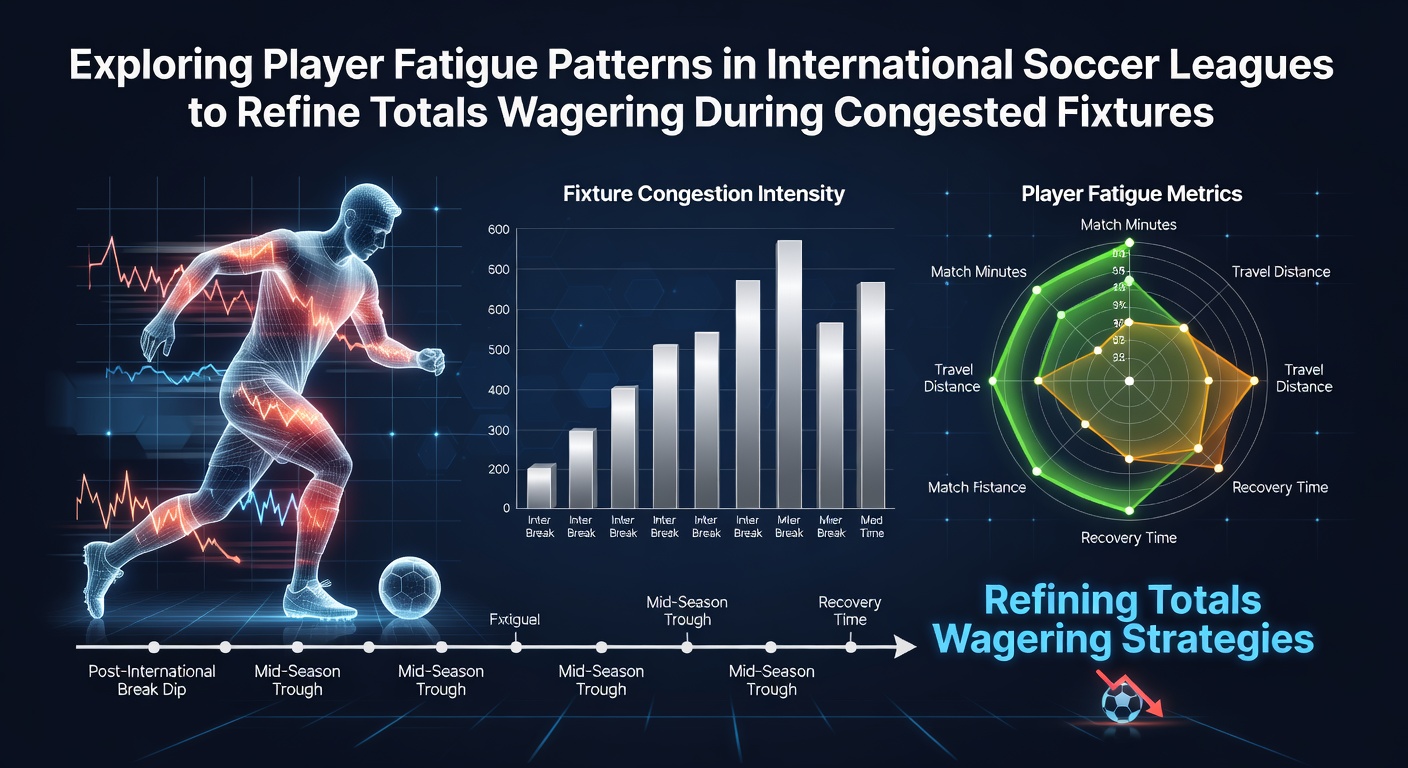
Exploring Player Fatigue Patterns in International Soccer Leagues to Refine Totals Wagering During Congested Fixtures
Player fatigue emerges as a measurable factor in international soccer leagues when fixture lists pile up without adequate recovery windows, and analysts track these patterns through metrics like distance covered per match, sprint frequency, and heart rate recovery times that dip noticeably after back-to-back games. Leagues such as the English Premier League, La Liga, and the Bundesliga schedule teams for three or four matches in a ten-day stretch during winter and spring months, while May 2026 brings additional pressure as clubs chase titles, European qualification spots, and domestic cups simultaneously. Data from performance tracking systems shows that midfielders and full backs accumulate the highest workload spikes, often exceeding 12 kilometers per game in these periods, which correlates with reduced high-intensity efforts in subsequent fixtures.
Mapping Congested Periods Across Major Leagues
European competitions create overlapping demands that compress schedules, and observers note how the UEFA Champions League and Europa League add midweek rounds that force rotation decisions. In the 2025-26 season, several Premier League sides faced five matches across 15 days in April and May, a pattern repeated in Serie A where travel distances amplify recovery needs. Researchers at institutions like the University of Barcelona have compiled datasets linking these clusters to drops in total distance covered by 8 to 12 percent in the third match of a congested block. Goalkeepers experience less physical strain yet show mental fatigue indicators through increased distribution errors, while strikers maintain goal-scoring output longer because their positional demands allow more selective running.
International breaks insert further variables, because national team call-ups pull players from club environments and expose them to different training loads before they return for league action. The FIFA calendar for 2026 includes qualifiers that coincide with domestic run-ins, leaving clubs to manage jet-lagged athletes whose sleep patterns and muscle soreness profiles deviate from baseline. Performance analysts compile these variables into fatigue indices that forecast when teams will underperform expected outputs, particularly in total goals scored or conceded.
Statistical Links Between Fatigue and Scoring Trends
Match data aggregated over multiple seasons reveals that teams playing their third fixture in eight days average 0.4 fewer goals per game than their season-long mean, while the opponent side often records elevated expected goals because defensive lines sit deeper and allow more transitions. This pattern holds across leagues, though it strengthens in physically demanding environments such as the Bundesliga where high pressing remains a tactical staple. Totals bettors examine these deviations because over/under markets adjust quickly once early results signal fatigue effects, yet pre-match lines sometimes lag behind the workload data released by clubs.
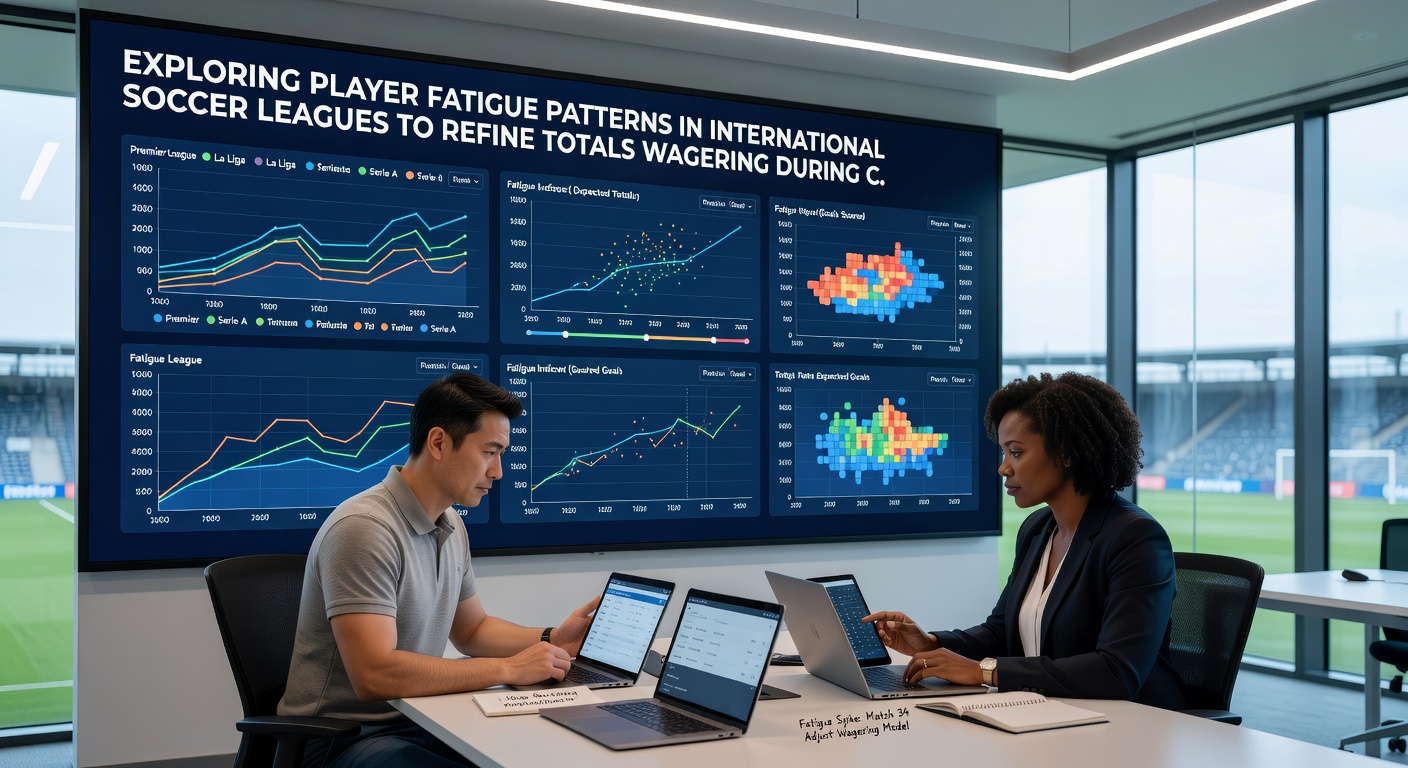
One dataset compiled by sports analytics firms tracks 1,200 congested fixtures from 2022 through 2025 and finds that under 2.5 goals lands 54 percent of the time when both sides average less than 48 hours between matches. The same study notes that corners and shots on target decline in tandem, which narrows variance in scorelines and produces fewer high-scoring outliers. Weather conditions compound these effects in northern leagues during May, where cooler temperatures preserve some freshness yet heavier pitches increase energy expenditure per sprint.
Refining Wagering Models With Workload Data
Betting markets incorporate fatigue signals through adjusted totals lines once schedulers release full calendars months in advance, and sharp operators monitor training ground reports plus GPS data leaks that indicate reduced session intensities. Models now weight recent match minutes for key players above 300 minutes in a 14-day window as a predictor variable, because empirical evidence shows these athletes register lower pass completion rates and fewer progressive carries. European governing bodies publish fixture density reports that allow independent verification of these thresholds without relying solely on club statements.
Rotation strategies employed by managers alter the equation, since substitutes introduced after 60 minutes demonstrate fresher closing speed and create late goals that push totals over the line. A 2024 academic paper hosted at journals.sagepub.com examined 300 matches and concluded that teams with at least four players rotated in the second half outperform their expected goal totals by 0.25 on average during congested weeks. Bettors therefore scan lineup sheets 90 minutes before kickoff for evidence of such adjustments rather than relying on historical averages alone.
Regional Variations and External Influences
South American leagues present distinct congestion patterns because travel distances between cities exceed European norms and CONMEBOL tournament schedules overlap with domestic play. Brazilian Série A sides often cover 1,500 kilometers midweek before returning for weekend fixtures, and fatigue metrics collected by local federations show elevated injury rates in the final third of the season. Australian A-League schedules align with northern hemisphere off-seasons yet still produce back-to-back games around international windows, allowing cross-league comparisons of recovery protocols. Regulatory bodies such as the Australian Sports Commission publish workload guidelines that clubs adopt to mitigate cumulative stress.
Technological tools now deliver real-time updates on player readiness through wearable devices, and these streams feed into predictive engines that recalculate totals probabilities every 15 minutes during congested blocks. The resulting edges appear most pronounced in lower-profile leagues where market liquidity remains thinner and line movements slower to reflect workload shifts.
Conclusion
Patterns of player fatigue in international soccer continue to shape totals wagering outcomes when fixtures cluster, because workload data reveals consistent reductions in attacking volume and defensive intensity across leagues. Analysts integrate these metrics with rotation histories and travel logs to refine expectations for goal tallies, particularly as May 2026 approaches and end-of-season pressures intensify. External sources ranging from academic journals to sports governing bodies supply the datasets that keep these models current, allowing objective assessment of when totals lines diverge from underlying performance trends.