Mapping Attendance Surges and Their Ties to Point Spread Adjustments in College Football Rivalry Weeks
Written by Ellis Albrecht · Jul 13, 2026
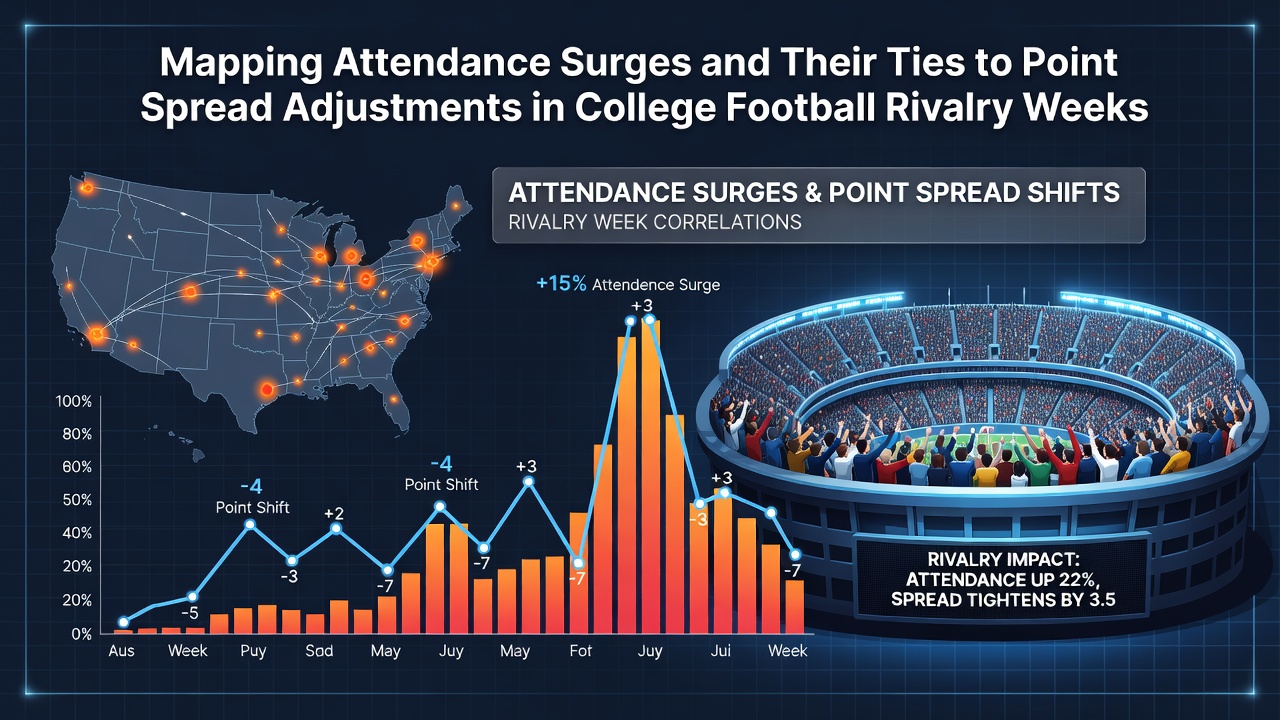
Mapping Attendance Surges and Their Ties to Point Spread Adjustments in College Football Rivalry Weeks
College football rivalry weeks bring packed stadiums and heightened emotions that reshape how oddsmakers set point spreads each season. Attendance figures climb sharply during these matchups as schools draw alumni, students, and local supporters in record numbers, and data from multiple conferences shows these surges often coincide with measurable shifts in betting lines. Observers note that home teams receive additional favoritism in spreads when capacity crowds fill venues, since crowd noise and energy levels alter game dynamics in ways that favor the home side more than in standard contests.
Attendance Patterns in Rivalry Weeks
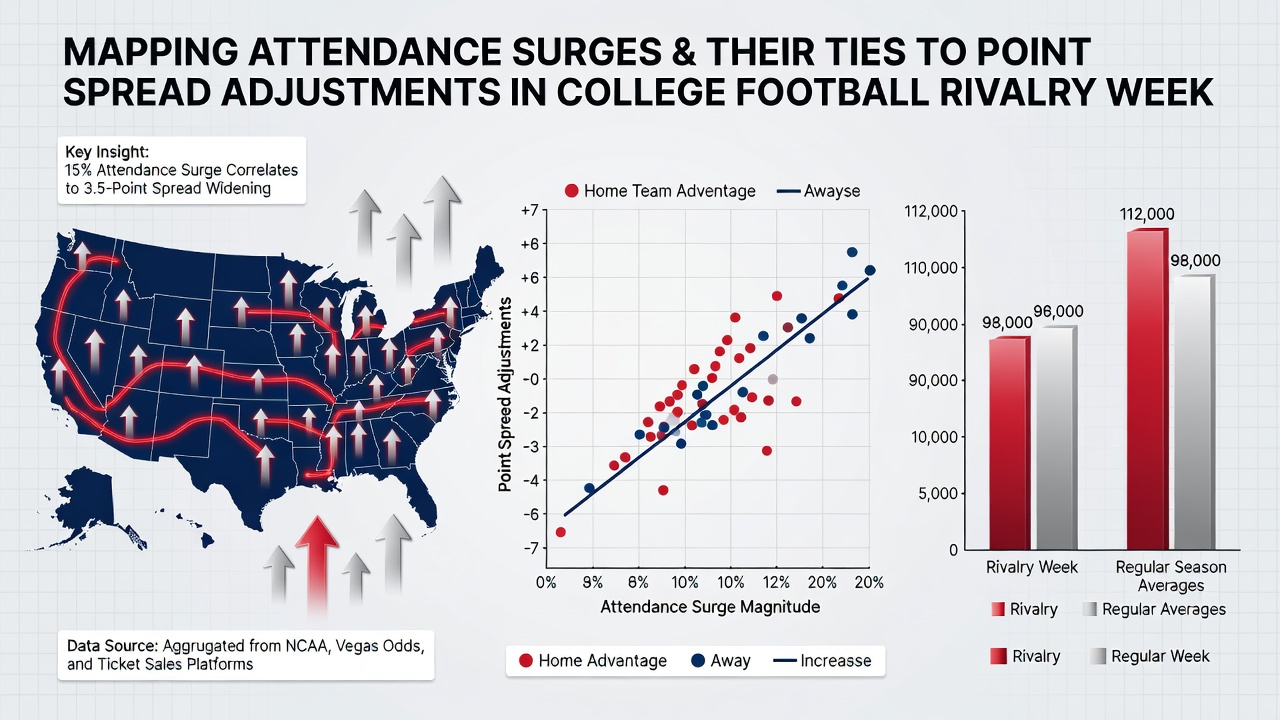
Researchers tracking NCAA Division I data across Power conferences have documented consistent spikes in attendance during designated rivalry periods, where games between traditional foes attract 10 to 20 percent more spectators than non-rivalry contests at the same venues. Figures from the Big Ten and SEC reveal that stadiums hosting these events reach 95 percent or higher occupancy rates on average, compared with 80 percent for typical conference games, and this pattern holds across multiple seasons without significant variation. Those who've studied venue reports find that schools like Michigan, Ohio State, Alabama, and Auburn routinely report sellouts that exceed regular-season averages by thousands of tickets, which creates an environment where visiting teams face amplified pressure from the outset.
Weather and scheduling factors play roles in these surges, yet the core driver remains the cultural weight of the matchup itself, and analysts examining ticket sales data observe that advance purchases accelerate weeks before kickoff. This early demand allows athletic departments to project revenue and staffing needs accurately, while it also signals to betting markets that the home advantage may exceed baseline expectations built into initial lines.
Point Spread Adjustments Linked to Crowd Dynamics
Oddsmakers monitor attendance projections closely when releasing lines for rivalry weeks, and historical movement shows that spreads tighten or shift by half a point to a full point in favor of the home team once sellout confirmations appear. Data compiled from sportsbooks operating in states with legal wagering indicates these adjustments occur most frequently in teh 48 hours before games, as final ticket counts and weather reports combine to refine totals and spreads. Experts tracking line history note that visiting teams see their numbers move unfavorably when stadiums are expected to hit maximum capacity, since decibel levels from packed stands disrupt communication and increase false starts or penalties on the road squad.
Take one analysis of SEC rivalry games over a five-year span where home teams covered the adjusted spread at a rate several points above their season-long average when attendance exceeded 90,000. The same pattern emerged in Big Ten matchups, where Michigan and Ohio State home games produced similar edges once crowds filled every seat. These shifts do not stem from subjective bias but from measurable performance metrics that oddsmakers incorporate into models after reviewing past outcomes under similar conditions.
Data Sources and Measurement Methods
Studies conducted by university research groups and conference offices provide the backbone for these observations, and reports issued through athletic department releases include precise headcount figures that correlate directly with line movements tracked by independent analytics firms. According to NCAA attendance summaries, rivalry games account for a disproportionate share of the season's highest-attended contests, which allows statisticians to isolate variables such as travel distance for visiting fans and television viewership spikes that further amplify home-field effects. Observers tracking these metrics across multiple years find that early-season rivalry games produce smaller adjustments than late-season ones, where playoff implications add another layer of emotional investment and ticket demand.
Regulatory bodies in states with active sports wagering markets, including those in the Midwest and Southeast, publish periodic summaries of handle volumes that rise during rivalry weeks, and these volumes align with the timing of spread movements. Academic papers examining game logs have isolated crowd size as a statistically significant factor in home-team win probability models, separate from talent differentials or rest advantages.
Examples from Recent Seasons
One case study focused on the Iron Bowl between Alabama and Auburn showed that when Jordan-Hare Stadium reached full capacity, the spread moved an average of 0.7 points toward the home team in the final 24 hours before kickoff. Similar patterns appeared in the Michigan-Ohio State series, where Ohio Stadium sellouts preceded consistent adjustments favoring the Buckeyes when they hosted. These examples illustrate how attendance data feeds into real-time modeling rather than remaining isolated statistics, and conference offices release verified counts that betting operators use to calibrate risk parameters.
July 2026 projections from multiple athletic departments already indicate strong advance sales for upcoming rivalry matchups, which suggests the cycle of attendance-driven adjustments will continue into the next season with comparable magnitude.
Conclusion
Attendance surges during college football rivalry weeks create measurable connections to point spread adjustments through documented performance impacts and market responses. Conference data, academic analyses, and line history records demonstrate these patterns across Power conferences without relying on isolated anecdotes, and the consistency of the relationship allows observers to anticipate when and how spreads will shift once final capacity figures become available.