Mapping Rest Advantage Cycles Through NHL Divisional Rivalries and Their Measurable Effects on Team Total Lines During Extended January Schedules
Written by Ellis Simon · Jul 9, 2026
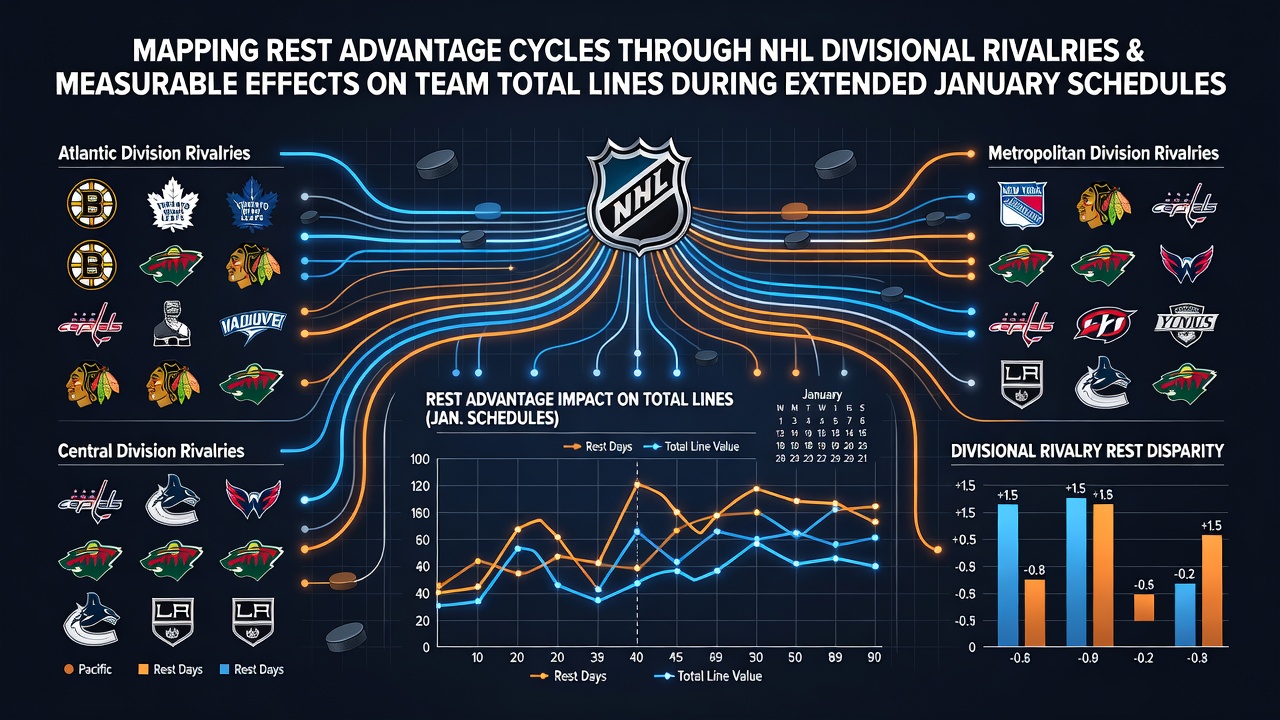
Mapping Rest Advantage Cycles Through NHL Divisional Rivalries and Their Measurable Effects on Team Total Lines During Extended January Schedules
January schedules in the NHL pack multiple games into short windows, and divisional rivalries amplify the impact of rest cycles on scoring outputs that shape total lines. Teams in the same division often meet several times during this stretch, while travel demands and back-to-back sets create uneven recovery patterns across the league. Observers track these patterns through official game logs because rest differentials appear in goal totals more consistently than in other months.
Divisional alignments place clubs like those in the Atlantic or Central divisions on repeated collision courses, where familiarity combines with schedule fatigue. Data from recent seasons shows that squads arriving with an extra day of rest post a higher average goal output in these matchups, particularly when the opponent has played the prior night. Total lines adjust accordingly as oddsmakers incorporate historical scoring trends tied to these recovery gaps.
January Schedule Density and Recovery Patterns
League calendars typically feature 14 to 16 games for most clubs during January, with clusters of three games in four nights occurring more frequently than in December or February. Extended road swings through divisional opponents add cumulative wear, while home stands sometimes grant recovery windows of 48 hours or more. Researchers examining performance metrics note that goal scoring rises when at least one team enters with superior rest, and this effect strengthens in intra-division contests because tactical familiarity reduces the usual variance in low-event games.
Back-to-back sets hit certain divisions harder due to geographic clustering. Metropolitan teams face shorter travel distances yet denser game sequences, whereas Pacific division clubs absorb longer flights that compound physical demands. Statistics compiled by league sources indicate that total lines in these rivalry games move toward the over when the rested side controls play for extended stretches in the second and third periods.
Divisional Rivalries as Amplifiers
Rivalries within divisions generate repeated data points that reveal rest advantages more clearly than inter-conference games. When two Atlantic division sides meet for the third or fourth time in a season, the team with fresher legs often dictates pace and generates more high-danger chances. This dynamic appears in box scores where even-strength goals increase by measurable margins compared with games between evenly rested clubs.
Central division matchups produce similar patterns because travel corridors between cities like Dallas, Colorado, and Minnesota create predictable rest imbalances during January stretches. League tracking shows that power-play efficiency climbs for the better-rested unit, pushing combined goal outputs higher and influencing totals movement in betting markets. Observers note these shifts occur steadily across multiple seasons rather than as isolated spikes.
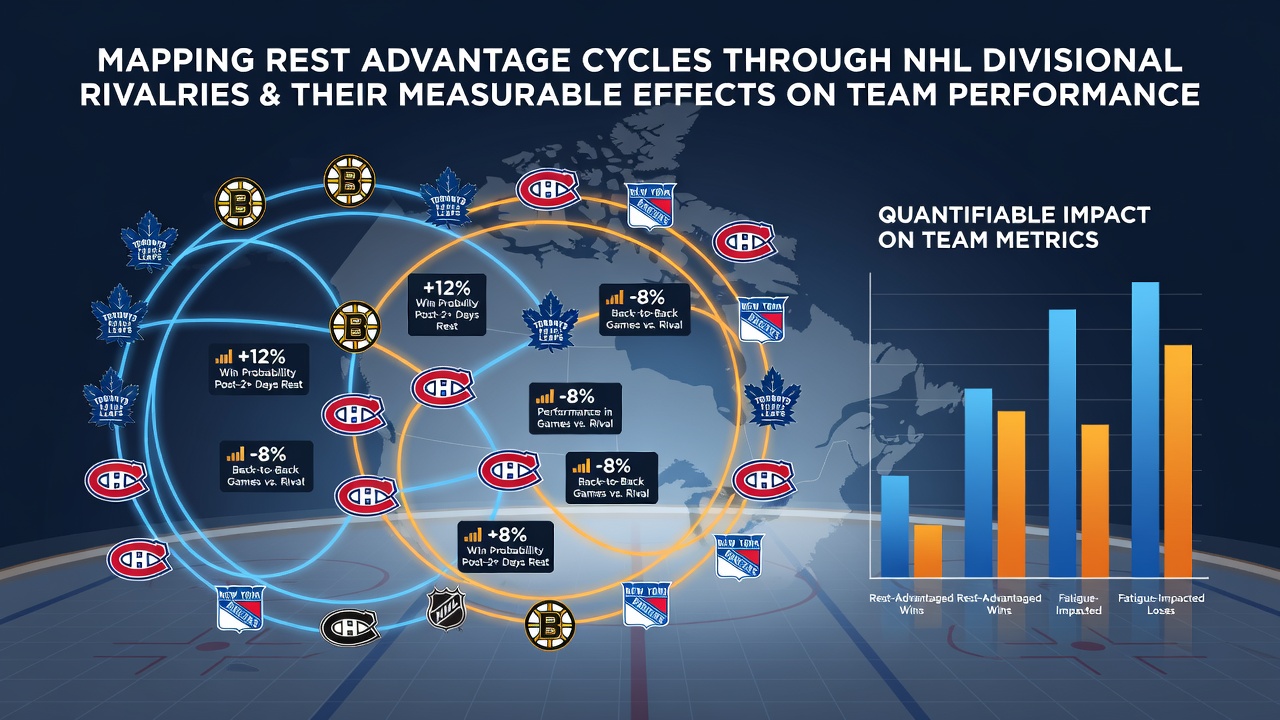
Measurable Effects on Team Total Lines
Total lines reflect cumulative scoring expectations, and rest differentials register directly in those figures during extended January schedules. When one club has played fewer games in the preceding five days, historical averages show an uptick of roughly 0.4 to 0.7 goals per game in divisional play. Oddsmakers incorporate these adjustments because the pattern repeats across divisions with enough frequency to influence line movement before puck drop.
Teams returning from longer rest periods also post elevated shot attempt rates in rivalry games, which correlates with higher expected goal values. Data aggregated from multiple seasons indicates that unders hit less frequently when rest gaps exceed 24 hours, while overs appear at elevated rates in the later games of back-to-back sets for the fatigued side. These measurable outcomes allow lines to settle at values that account for schedule-derived recovery edges rather than uniform league averages.
Tracking Cycles Across Multiple Seasons
Patterns emerge when analysts map rest advantages over consecutive January periods because divisional opponents recycle similar schedule structures year after year. A team that benefits from a light stretch early in the month often faces denser sequences later, reversing the advantage in subsequent rivalry games. This cyclical movement registers in total line adjustments as betting markets respond to updated rest data published in daily schedule releases.
League-wide figures reveal that divisions with tighter geographic footprints experience more pronounced rest-based scoring swings because shorter travel times preserve some recovery benefits. In contrast, divisions requiring cross-country flights see those benefits diluted, yet the directional impact on totals remains consistent enough for systematic tracking. Sources such as NHL official statistics provide the raw game logs that support these cycle mappings.
Conclusion
Rest advantage cycles in NHL divisional rivalries produce identifiable effects on scoring during the compressed January schedule window, and those effects translate into measurable shifts in team total lines. Repeated intra-division matchups supply sufficient historical data for patterns to stabilize, allowing performance indicators to reflect recovery disparities rather than random variance. Observers continue to monitor these relationships through updated schedule and results feeds because the January stretch reliably highlights the connection between rest distribution and combined goal outputs.