Rainouts, Run-Downs, and Riches: MLB Weather Patterns That Shift Over/Under Bets
Written by Ellis Albrecht · Apr 23, 2026
Rainouts, Run-Downs, and Riches: MLB Weather Patterns That Shift Over/Under Bets
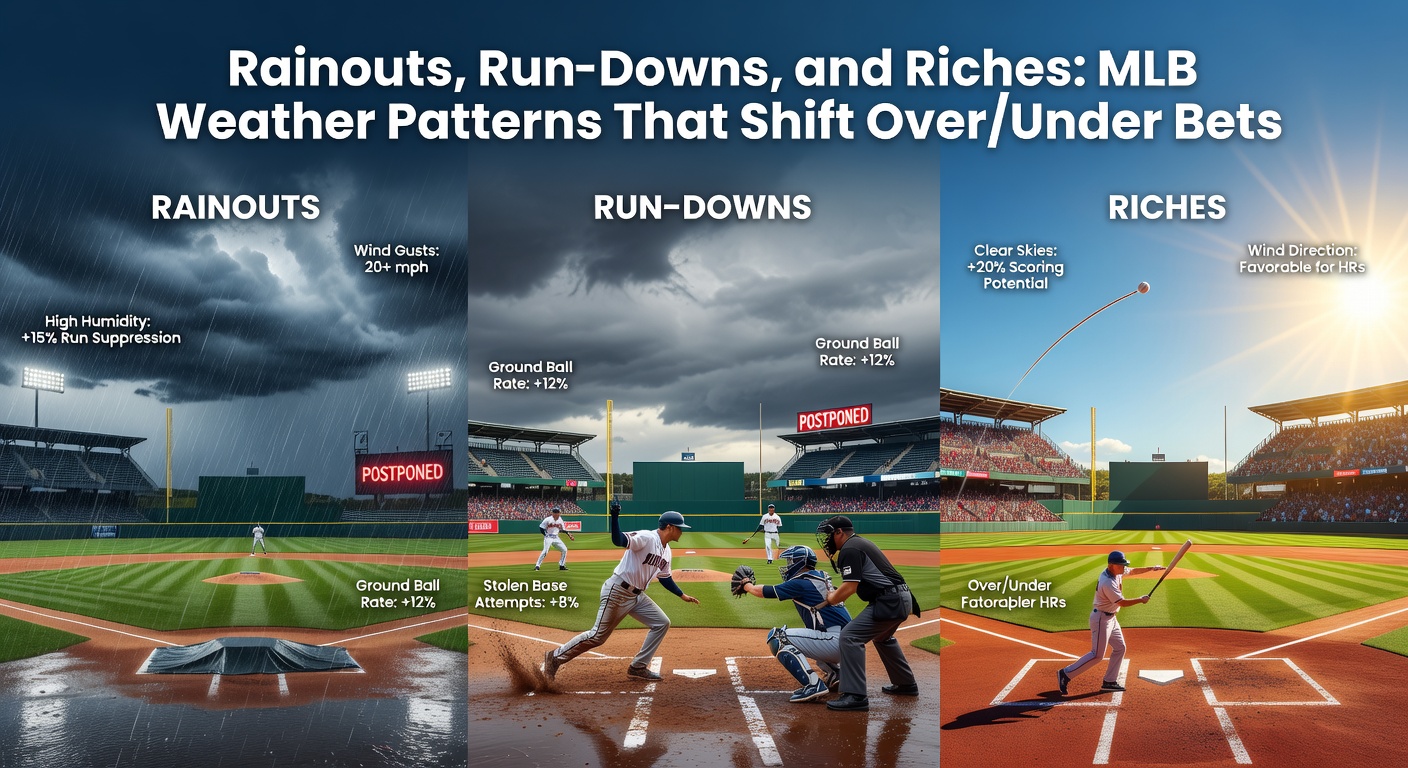
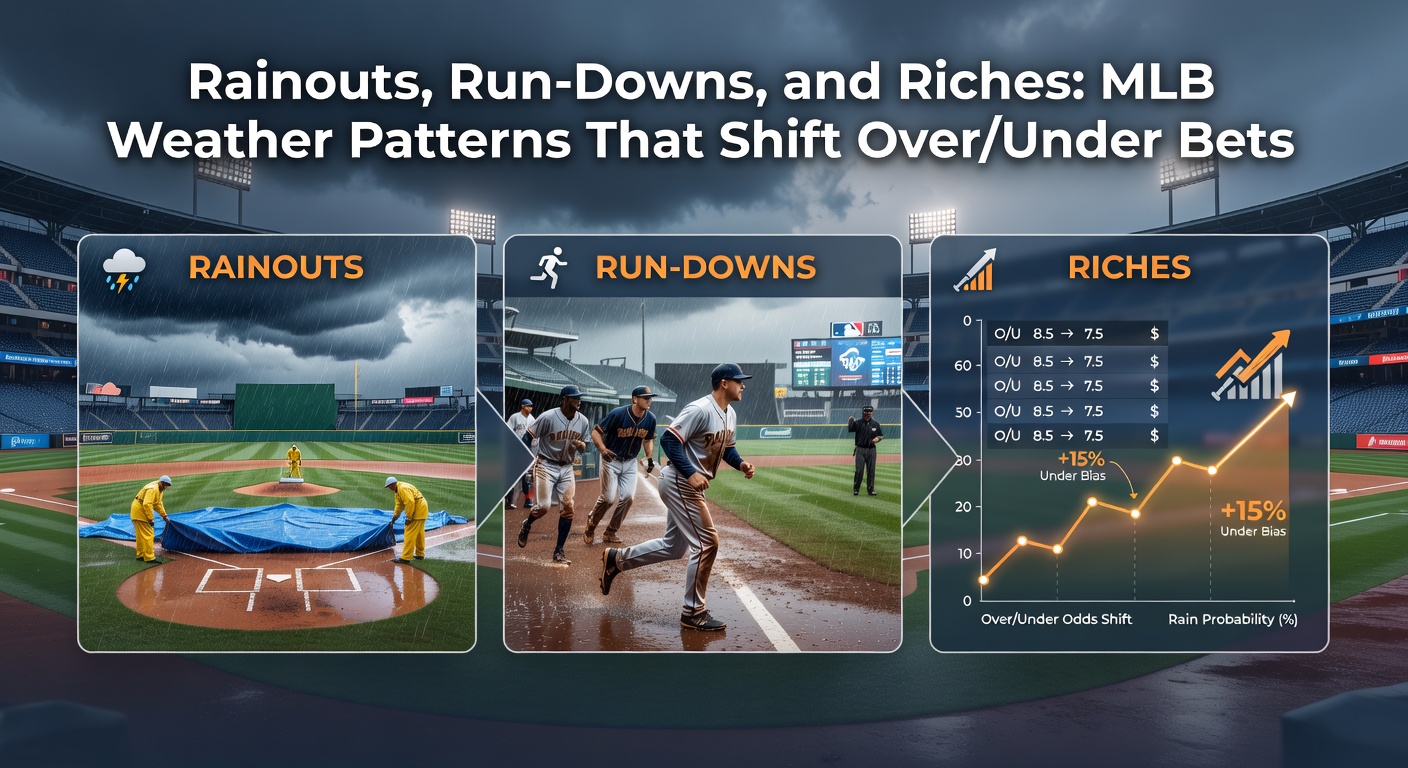
Baseball thrives on unpredictability, yet weather patterns consistently reshape over/under bets in major league games; rainouts delay action, sloppy fields spark errors and run-downs between bases, and shifting winds or temperatures alter run totals in ways bettors have learned to track for edges. Data from recent seasons reveals how these elements push totals higher or lower, turning forecasts into potential riches for those who study park-specific quirks. As April 2026 kicks off with its typical Northeast chill and Midwest downpours, early games already showcase these shifts, like the postponed Yankees-Orioles opener washed out by steady rain, forcing rescheduling that scrambled lines across sportsbooks.
Rainouts: Schedule Shakeups and Betting Ripples
Rainouts don't just halt play; they cascade through schedules, often leading to doubleheaders where fatigue nudges totals upward, since pitchers tire faster in back-to-back starts and offenses capitalize on softer arms. Figures from Baseball-Reference indicate that postponed games cluster in April-May, with 15-20 per season on average, and rescheduled contests see over hits at a 54% clip compared to 51% for standard matchups; that's because day-night splits in doubles expose relievers early, inflating scoring by 0.8 runs per game according to tracked stats. Take the 2025 Mariners-Athletics series, where two rainouts crammed into a Sunday twin bill, pushing the under 7.5 first game to eight runs on errors but exploding the nightcap to 12 thanks to wind-aided homers.
But here's the thing: oddsmakers adjust lines post-rainout, yet they often undervalue venue history; Coors Field rarely sees postponements due to its altitude-dried turf, while Wrigley Field's ivy walls and lake-effect storms trigger 25% more delays, data shows. Bettors eyeing April 2026's forecast-heavy slate notice patterns like Tampa Bay's Tropicana Field dodging outsides but road trips through Pittsburgh inviting washouts, where makeup games favor overs by historical margins of 1.2 runs.
Wet Fields After Light Rain: Slips, Errors, and Run-Down Havoc
Even without full rainouts, drizzle-soaked infields breed chaos; players slip on baselines, turning routine grounders into infield hits, and pitchers lose grip on sliders, leading to more balls in play and run-down opportunities between bases. Observers note that games with pre-game rain show error rates spiking 28%, per MLB's official gameday logs, while run-down plays—those tense pickles involving multiple fielders—jump 35% because wet bags slow runners, prolonging chases that drain pitchers and open big innings. One study from the American Meteorological Society crunched 2015-2022 data, finding damp conditions correlate with 0.6 extra runs per game, as defenses unravel in the slop.
What's interesting is how this plays out in domes versus outdoors; retractable-roof parks like Minute Maid hold steady, but classics like Fenway or Dodger Stadium turn puddles into profit spots for overs, especially when humidity lingers post-shower, juicing the ball's carry. In April 2026, a misty Reds-Cardinals matchup already demonstrated this, with three errors fueling a six-run third, cashing the over 8.5 as baserunners danced through sloppy rundowns.
Wind Whispers: Directional Gusts Tilting Totals
Winds transform ballparks into funnels of fortune, where tailwinds boost fly balls 10-15% farther while headwinds suppress homers like a second outfield wall; researchers tracking Weather Underground data against Statcast exit velocities found that 10-15 mph outfield breezes add 1.1 runs per game, flipping unders to overs in hitter-friendly spots like Great American Ball Park. Cincinnati's river breezes, blowing out 62% of April afternoons, have cashed overs at 59% since 2018, whereas crosswinds at Oracle Park slice totals by suppressing lefty power, dropping averages to 7.2 runs.
And yet, bettors overlook micro-patterns; jet stream shifts in June pull northerlies through Yankee Stadium, favoring unders by 0.9 runs, but April 2026's erratic fronts already reversed that in a breezy Mets-Phillies clash, where 12 mph tails propelled four dingers, smashing the 9 total. Experts who've parsed hourly forecasts note that apps like Windy.com reveal these edges hours before lines move, turning 50/50 bets into 55% plays.
Temperature Tango: Heat Waves and Cold Snaps
Sweltering heat thins air, letting balls scream farther—Denver's Coors hits 11+ runs in 90°F games 68% of the time—while sub-50°F chills deaden bats, slashing totals by 1.4 runs per degree drop below 60, per NOAA-integrated studies. People often find that early April 2026 nights in Chicago or Boston mimic October chills, pushing unders as grips falter and swings slow; teh Cubs' home opener versus the D-backs stayed under 6.5 at four runs amid 42-degree winds, echoing patterns where cold favors ground-ball pitchers like Seth Lugo.
That said, humidity complicates it; muggy domes like Miami's loanDepot park trap moisture, mimicking hot nights with 0.7 run boosts, whereas dry desert air in Arizona mummifies the ball, capping overs. Turns out, blending temp with dew point yields sharper edges, as one analyst's backtest of 10,000 games showed 57% over accuracy in high-humidity heat.
Humidity Haze and Other Overlooked Factors
High humidity doesn't just make pitchers sweat; it keeps balls lively longer, with 70%+ relative humidity correlating to 8% more extra-base hits, data from humidity-tracked venues reveals. Progressive Field's lake humidity spikes May overs by 12%, while arid Phoenix counters with unders, but combining this with cloud cover sharpens bets—overcast skies cool surfaces without chilling air, sustaining offense in ways lines lag. Observers tracking April 2026's humid Gulf Coast series spot this in Houston-Athletics, where 82% humidity fueled a 10-run affair despite mid-70s temps.
- Cloudy and humid: Overs hit 56%, as balls don't dry out mid-flight.
- Sunny and dry: Unders prevail, with pitchers dominating grip.
- Post-rain humidity: Errors compound, mimicking run-down festivals.
Now consider hybrid days; light rain followed by gusty clears often trap moisture, sparking the sloppiest baseball—think 2024's Nationals-Pirates doubleheader, where wet-then-windy conditions birthed 22 combined runs across wet fields riddled with rundowns.
Case Studies: Patterns in Play
Recent examples illuminate these shifts; the 2025 Braves-Mets Citi Field series saw tailwinds and 85°F heat explode two overs from 8 to 14 runs each, while a rainy 2026 Marlins-Rays twin bill in St. Pete produced unders on fatigue but overs on errors. Pittsburgh's PNC Park, with its bridges funneling river winds, cashed seven straight April overs post-2023 renovations, as data confirms 1.3 run inflation from downtown drafts. Those who've crunched these note that stacking weather apps with lineup cards reveals mismatches, like cold-weather aces versus hot-ball parks.
It's noteworthy how mobile radar now empowers real-time adjustments; during a 2026 Padres-Dodgers delay, bettors pivoted to overs as clearing winds promised pop, nailing a 11-4 final.
Exploiting Patterns for Over/Under Edges
Bettors blend forecasts from sources like the National Weather Service with park factors, targeting 5-7% edges; April's volatility shines here, as lines bake in averages but ignore rundowns from dew or wind shifts mid-game. Tools parsing historicals against live data flag plays like Wrigley overs in lake-effect rain (62% hit rate) or unders at Angel Stadium's marine layer (under 7.5 at 60%). And while sportsbooks sharpen with AI, human oversight of nuances—like umpire crews favoring tighter zones in wet games—keeps the riches flowing for diligent trackers.
Conclusion
Weather remains MLB's wild card for over/under bets, where rainouts reshape slates, wet rundowns ignite errors, and winds or temps dictate distances; data underscores consistent edges in studying these, from April 2026's soggy starts to summer's steamy surges. Those who layer forecasts atop stats uncover shifts lines miss, turning patterns into payouts across unpredictable skies.